Commentary
Hello readers. In last week’s post, I discussed how I’ve been actively forward-testing a new model calibration that’s shown early promise. The core function I’m using is:
where:
z is the coefficient value reached during the February 2020 calibration
A value of 1.0 represents the locked condition for calibration that delivered strong backtest performance in February 2020.
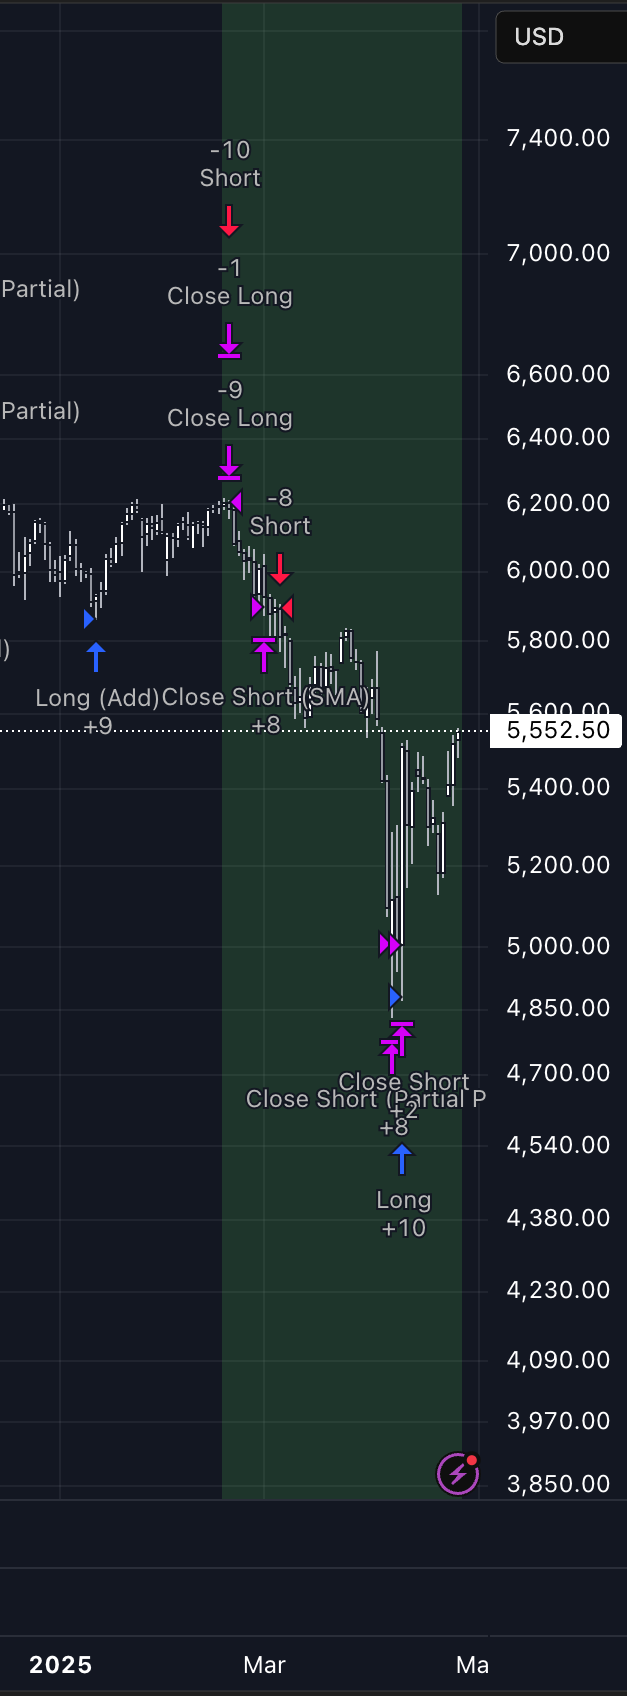
Thinking about this function recursively makes sense: we first reverted to the 1.0 baseline, which led to strong results throughout 2020–2021. Adding a logarithmic adjustment based on the February 2020 value (z) has shown promising results during the February 2025 selloff as well. This recursive structure integrates cleanly with the broader strategy and has improved model behavior in backtesting, prompting a long entry off the April 9th lows after partially closing shorts on April 7th.
Another way to think about it is that initially, z takes a value of 1.0 (the baseline that performed well in 2020), so f(z) = 1.0. Then, using the calibrated February 2020 value for z generates a new adjustment that has, so far, worked well for the February 2025 environment.
Looking at recent price action, I identified a range of coefficient values that would have worked well in hindsight. From this, I derived the function above—effectively combining insights from the 2020–2021 calibration period with more recent dynamics to generate robust trading outcomes.
This newly calibrated model has closed all long positions initiated on April 9th and has now flipped short as of the Globex open. Historically, my model doesn’t suffer large drawdowns from the open, so if price moves more than 30–40 points against the position on ES (or 180–220 points on NQ), that may indicate this calibration is off—similar to last time.
But if the signal holds, I believe this short has potential: a move of 2,000+ points on NQ and 400+ points on ES. I'm willing to scale into this short, with stops roughly 40 points above the ES opening price at 6pm ET (or 180–220 points on NQ).
Model Metrics
As of close April 29th, 2025 with the new calibration function defined above
Regression Curve Metric: +2,682.56 [Overbought: +2,700, Oversold:-330]
Regression Curve Metric (Daily Difference): 328.69
Maximum Regression Curve Metric: +2,726.49
Minimum Regression Curve Metric: +2,513.02
Regression Curve Metric (Forward Looking): +2,718.33 [Overbought: +2,700, Oversold:-340]
We reached +2,680 on July 11, 2024 which made for an excellent sell entry so my strategy has given some leeway to the closing model curve metric price — allowing it to flip short even if it closed at +2,682.56. The forward looking regression curve metric closing above +2,700 adds confluence.
We are highly dependent on the model calibration here which has worked well in its 1 sample size backtest so far — thus I’m sizing appropriately. We are forward testing this and while rallying further would be frustrating — it would mean progress by elimination for my model calibration.
Positions Update
Short -10 ES 5,579.50 from April 29, 2025
Short -10 NQ 19,599.75 from April 29, 2025


